
SciFig
Make scientific illustrations, data charts and flowcharts
Screenshots


Freemium
AI
Built with React
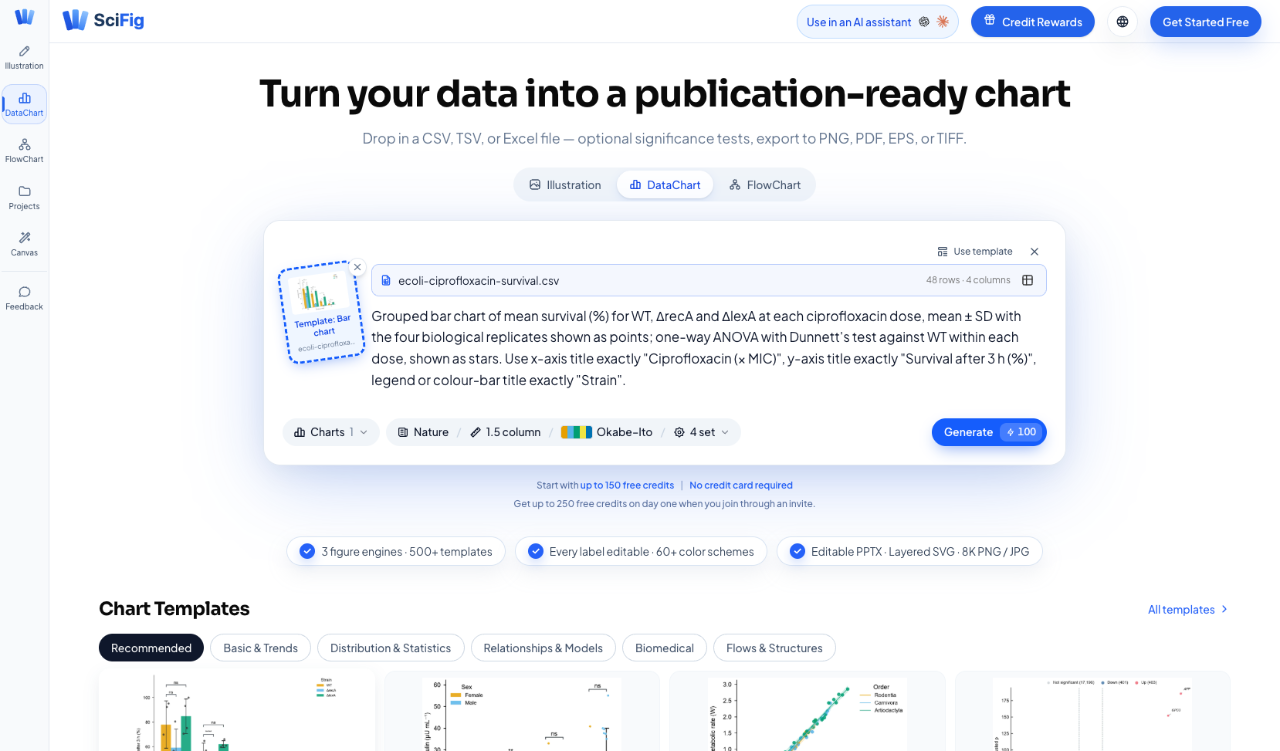
ReactSciFig is a browser-based workspace for creating scientific illustrations, data charts and flowcharts. Researchers can use it to prepare visuals for manuscripts, posters and presentations. DataChart works with table data, while FlowChart supports editing nodes, text and connections and exporting diagrams as SVG.
Loading...
Related products
View all





More categories
All categories







Launched in Week 53, 2026
See the week


Send automated direct messages from Instagram keyword commen
0
Social Media, Marketing Automation, Lead Generation
0
Social Media, Marketing Automation, Lead Generation
55d17h59m
Launches in55days
:17hours
:59mins
:04secs

Budget app and expense tracker with 166 currencies
0
Personal Finance, Budgeting, Expense Tracking
0
Personal Finance, Budgeting, Expense Tracking
55d17h59m
Launches in55days
:17hours
:59mins
:04secs