
Plotiq
Free CSV to chart tool. Generate visuals, Drag-and-Drop
Screenshots


Free
SaaS
Productivity
Analytics Tool
Built with Flutter
 Firebase
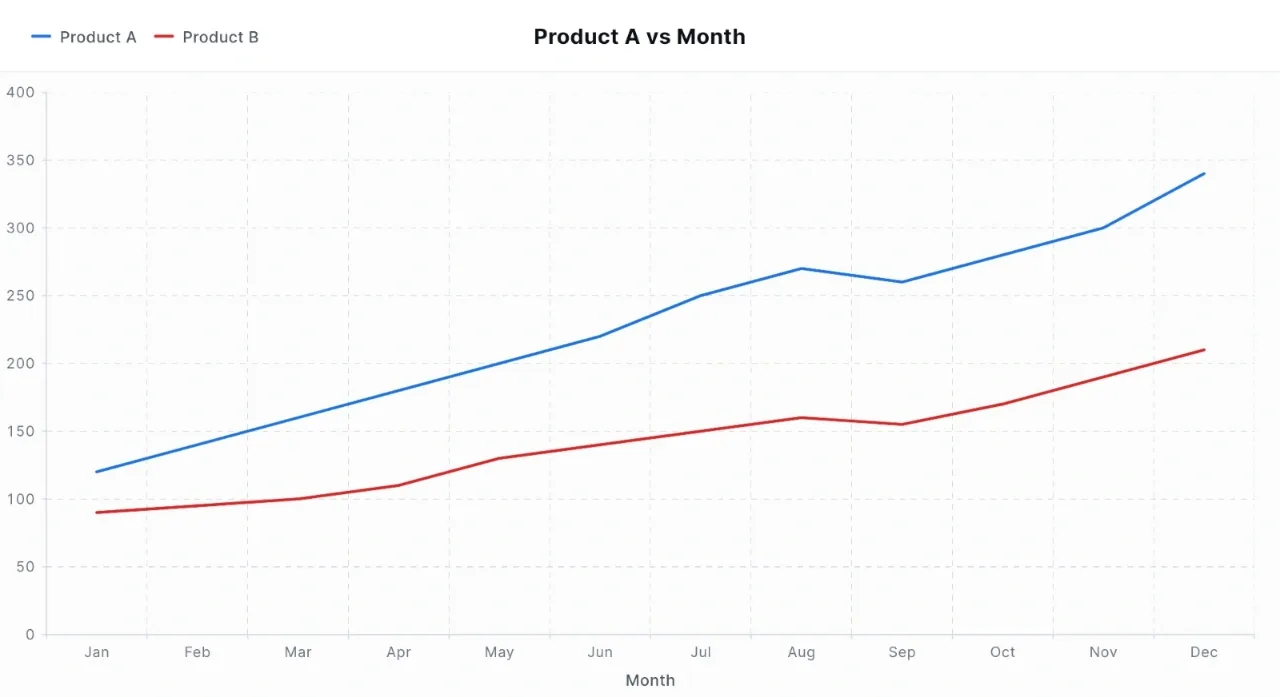
FlutterFirebaseEasily turn your CSV files into clear, interactive graphs in seconds. Whether you’re a student, researcher, data analyst, or just exploring data, our tool makes visualization simple and fast - no coding required. Upload your data, choose your graph, and get insights instantly.
Loading...










 Prev
 Next