


A dashboard becomes useful when its data is easy to understand. Showing numbers is only the first step. Developers also need to select visualizations that explain relationships, reveal trends, and help users decide what to examine more closely.
A revenue trend, for instance, should make changes over time clear. A marketing breakdown should communicate how different sources contribute to a total. A financial report should make revenue and expenses easy to compare.
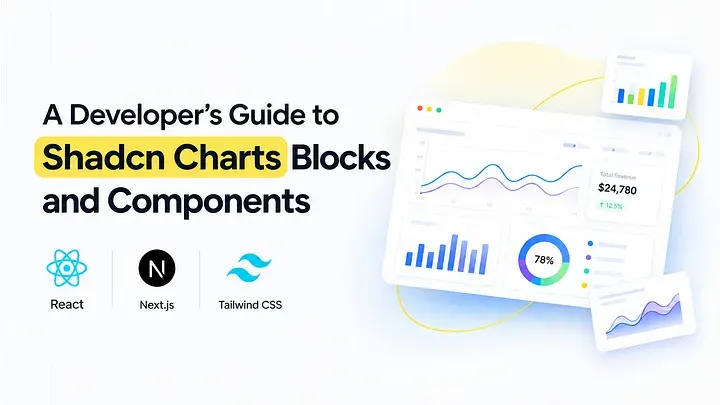
Shadcn Charts offer React and Next.js developers a foundation for building these data-driven interfaces. This guide explores chart selection, installation, and practical examples for SaaS analytics, sales reporting, financial dashboards, marketing insights, and product analytics.
What Makes a Chart Component Useful for Developers?
A chart component should be understandable and adaptable, not simply visually appealing. Before integrating it, developers need to know how data is supplied, which fields are required, how the chart behaves in different layouts, and how it fits into the application's interface.
The examples covered here focus on common dashboard requirements. Each component can be assessed by its purpose, data relationships, configuration options, integration process, and readiness for a production environment.
Consider the following questions when evaluating a chart:
Which business or user question should it answer?
Is the data intended to compare categories or show a change over time?
What values, labels, and units need to be displayed?
Will users need tooltips, legends, or filters?
Does the chart fit the existing page layout?
What is required to connect it to the application's data?
These considerations help developers select a visualization that serves a clear purpose instead of choosing one only for its appearance.
You can explore additional layouts in the dashboard UI blocks collection.
What Are Shadcn Charts?
Shadcn charts follow the shadcn/ui component approach, where implementation code is added directly to the project. Developers can inspect and customize the component instead of depending on a fixed external chart widget.
Recharts is commonly used for chart functionality such as axes, data series, tooltips, and legends. React handles the component structure, while Tailwind CSS can style the surrounding layout and interface elements.
This setup is useful when a chart must align with an application's existing design system or work with a particular data model. Developers can modify the implementation to support their metric definitions, formatting preferences, and reporting requirements.
The available shadcn chart blocks cover several frequently used dashboard scenarios.
How Shadcn Charts Fit Into a Development Workflow
A chart integration usually begins with a metric and a visualization choice. Next, developers install the component, map application data to the expected fields, adjust the chart configuration, and test it within the page where it will be used.
The examples in this guide cover sales, revenue, expenses, marketing channels, product metrics, settlements, and forecasting. These use cases can support SaaS applications, ecommerce platforms, CRM systems, and internal reporting tools.
The technology stack includes React, Next.js, Tailwind CSS, and Framer Motion, with Recharts handling visualization where applicable. Review the dependencies and implementation details of the individual component before adding it to your project.
Install a Chart Through the CLI
Here is an example using pnpm:
npx shadcn@latest add @shadcn-space/chart-01Execute the command from your project directory and inspect the generated files. Some components may need additional dependencies or configuration based on their implementation.
The same general workflow is available for npm, yarn, and bun. After installation, connect the chart to your application's data and configure its labels, values, and formatting.
Selecting the Correct Visualization
The relationship between the data points should guide your chart selection.
Bar charts are useful for comparing categories or reporting periods.
Line charts make changes across a timeline easier to follow.
Area charts emphasize volume and movement over time.
Donut charts communicate how a total is divided into categories.
Gauge charts present a metric against a defined scale.
Radar charts compare several related dimensions.
Keep the visualization easy to interpret. Too many categories, overlapping series, or unclear labels can make a chart difficult to use. When precise values matter more than visual comparison, a table may be a better choice.
Shadcn Chart Components for Common Dashboard Tasks
Sales Performance Bar Chart

This chart brings several financial measures into a shared view, allowing users to compare earnings, profit, and expenses across reporting periods.
It can serve as a financial dashboard summary for users who want to review the main figures before moving into a detailed report. Connect it to the application's actual financial data and maintain consistent definitions for each metric.
Use cases:
Compare earnings, profit, and expenses.
Review business results across reporting periods.
Monitor financial changes.
Summarize financial performance.
Build a financial overview section.
Best for: Financial dashboards that need to display key business metrics together.
Earnings Pie Chart with Donut Text

This visualization combines a central earnings value with a category-based breakdown. Users can read the overall amount and see how individual sources contribute to it.
It is suitable for compact dashboard cards where both the headline figure and its distribution matter. Keep the number of visible categories limited so the chart remains clear.
Use cases:
Show total earnings and revenue distribution.
Compare income sources.
Review channel contributions.
Summarize financial categories.
Display a compact revenue breakdown.
Best for: Revenue dashboards that need to communicate income distribution.
Yearly Sales Comparison Area Chart

An area chart can help users examine sales activity over longer periods. It highlights changes in volume and supports comparisons between reporting intervals.
Choose this visualization when historical movement is important to the analysis. Consistent time intervals and readable date labels help users understand the trend.
Use cases:
Compare sales across years.
Examine seasonal performance.
Track long-term growth.
Identify changes in sales volume.
Review historical sales data.
Best for: Business analytics dashboards that include historical sales reporting.
Weekly Sales Bar Chart

This chart presents recent sales activity in a concise format. Users can compare daily values and identify differences without opening a separate report.
It works well for teams that review short-term sales performance regularly. The reporting window can be adapted to the application's requirements.
Use cases:
Compare sales by day.
Identify peak activity periods.
Monitor recent sales results.
Display weekly performance.
Support operational reviews.
Best for: Sales dashboards focused on short-term performance.
Revenue vs Expenses Bar Chart

This chart places revenue and expenses side by side to make their relationship easier to understand. Users can see whether costs are moving in the same direction as income and begin evaluating financial performance.
Use it when direct comparison is the main objective. Keep the reporting periods and currency formats consistent across the two series.
Use cases:
Compare revenue with expenses.
Review operating costs.
Track monthly financial performance.
Identify spending changes.
Support cash flow analysis.
Best for: Financial dashboards that compare income and costs.
Sales and Profit Overview Line Chart

This line chart follows sales and profit over time. It can help users recognize trends and identify periods when the two metrics move differently.
The visualization is useful for ongoing performance monitoring because users can inspect the overall direction as well as individual values. Clear tooltips and labels help explain each data point.
Use cases:
Monitor sales growth.
Track profit trends.
Compare financial performance over time.
Identify significant changes.
Review business performance in SaaS analytics.
Best for: SaaS and business dashboards with time-based performance metrics.
Sales Comparison Area Chart

This area chart compares sales activity from different channels over time. It can show how overall activity changes while also communicating each channel's contribution.
Use it when channel performance is an important part of business reporting. Keep the category definitions and time intervals consistent throughout the visualization.
Use cases:
Compare online and offline sales.
Monitor channel performance.
Review sales movement.
Analyze channel contributions.
Track sales across multiple sources.
Best for: Ecommerce dashboards and omnichannel reporting interfaces.
Product Sales Performance Gauge Chart

A gauge chart displays a metric against a defined range. It is useful when users need to assess a value or target quickly without examining a detailed trend.
For example, a dashboard could use a gauge to show progress toward a sales goal. Add a clear label and explain the target or scale so users can interpret the value correctly.
Use cases:
Track progress toward a target.
Summarize product performance.
Highlight a key metric.
Review goal completion.
Present a compact performance indicator.
Best for: Product dashboards that use target-based metrics.
Pipeline Performance Radar Chart

This radar chart compares several related performance dimensions in one visualization. Sales teams can use it to review pipeline indicators together and identify areas that may need attention.
It is most useful when the measures share a meaningful scale. If the dimensions use different units or ranges, normalize the values or consider a different chart type.
Use cases:
Compare pipeline indicators.
Review lead conversion.
Monitor win rates.
Compare related sales metrics.
Identify performance gaps.
Best for: CRM dashboards and sales analytics interfaces.
Marketing Report Donut Chart

This chart illustrates how marketing traffic or acquisition is divided among different sources. It provides a compact way to compare categories and understand their contribution to the total.
Use clear source labels and group smaller categories when needed. For comparisons involving many sources or precise values, a bar chart may be easier to interpret.
Use cases:
Compare website traffic sources.
Review organic and referral traffic.
Analyze acquisition channels.
Monitor campaign contributions.
Summarize marketing data.
Best for: Website analytics and marketing reporting dashboards.
Profit and Expense Bar Chart

This chart focuses on the relationship between profitability and costs. It can help users compare financial performance across reporting periods or selected categories.
Use descriptive metric names and consistent number formatting. Make the reporting period and included expense categories clear so users understand what they are reviewing.
Use cases:
Compare profit and expenses.
Track operating costs.
Review financial performance.
Monitor spending changes.
Build financial reporting sections.
Best for: Profitability monitoring and cost analysis.
Profit and Expense Comparison Chart

This chart can provide a more detailed comparison when profit and expense data is grouped differently from the primary financial overview. For example, it may compare business units, cost centers, or selected reporting periods.
The component should answer a distinct question rather than repeat the same information. Use a descriptive title and clear categories to explain the purpose of the comparison.
Use cases:
Compare expenses across business units.
Review financial results by department.
Monitor cost changes.
Compare earnings and spending.
Support internal reporting.
Best for: Detailed financial analysis across business categories.
Product Sales Line Chart

This chart tracks product sales alongside related customer activity over time. It can help product teams understand whether changes in demand occur alongside changes in customer growth.
Use consistent time intervals and review the scale of each series. If the measures are not directly comparable, separate charts may present the data more clearly.
Use cases:
Monitor product sales.
Track customer growth.
Compare sales and customer trends.
Review demand over time.
Analyze product performance.
Best for: Product analytics and customer growth reporting.
Total Settlements Area Chart

This area chart displays settlement activity over time. It can be useful for payment systems and financial applications where users need to review changes in transaction volume.
Adapt the chart's values and labels to represent settled amounts, withdrawals, or other related measures. Use precise terminology to make the displayed information clear.
Use cases:
Monitor settlement totals.
Track payment activity.
Review withdrawal trends.
Analyze transaction volume.
Build financial operations dashboards.
Best for: Payment applications and settlement reporting.
Revenue Forecast Bar Chart

This chart compares projected revenue across periods or categories. It is useful for planning workflows where users need to compare forecast values directly.
Keep projections distinct from actual results and label the forecast period clearly. The visualization should display values generated by the application's forecasting process rather than imply that the chart itself predicts future results.
Use cases:
Compare projected revenue.
Review expected profit.
Support budget planning.
Compare future reporting periods.
Present financial projections.
Best for: Financial planning and revenue forecasting dashboards.
Revenue Forecast Line Chart

A forecast line chart communicates the expected direction of revenue over time. It helps users review how projections change between reporting periods and can provide context alongside historical results.
Differentiate forecast values from actual results and use readable date labels. If projections depend on assumptions, document those assumptions near the chart.
Use cases:
Track projected revenue.
Compare forecasts with historical performance.
Review expected growth.
Support planning workflows.
Display revenue expectations over time.
Best for: SaaS analytics and financial planning interfaces.
Revenue Updates Bar Chart

This chart helps users review revenue changes across reporting periods. Its direct layout makes it suitable for identifying increases, declines, and differences between recent results.
Use readable values and consistent categories. If users need additional context about a change, connect the chart to a detailed report or include a supporting breakdown.
Use cases:
Compare monthly revenue.
Monitor recent financial results.
Identify increases and declines.
Track business performance.
Support recurring revenue reports.
Best for: Revenue tracking and executive dashboard summaries.
Department Stats Radial Chart

A radial chart can display department statistics in a compact visual format. It is useful when users need to review a department's contribution, share, or progress against a defined target.
Make the meaning of the radial value clear through labels and supporting context. When comparing multiple departments, use consistent scales and avoid crowding the visualization with too many values.
Use cases:
Summarize department statistics.
Compare departmental contributions.
Display progress against a target.
Highlight department-level metrics.
Support organizational dashboards.
Best for: Department dashboards that need a concise view of key statistics.
Sales Overview Stacked Bar Chart

A stacked bar chart combines multiple sales categories within each bar. It helps users understand the overall total while also showing how individual categories contribute to that value.
Use consistent category colors and labels to make comparisons across periods easier. This chart is particularly useful when both the total and its composition matter to the reporting task.
Use cases:
Compare sales categories.
Review total sales by period.
Understand category contributions.
Monitor sales composition.
Support a sales overview dashboard.
Best for: Sales dashboards that compare totals and category-level contributions.
Attendance Overview Line Chart

A line chart can show how attendance changes across a series of dates. It helps users recognize trends, recurring changes, and periods that may require closer review.
Use consistent date intervals and clear value labels. If the visualization compares attendance across multiple groups, make each series easy to distinguish.
Use cases:
Track attendance over time.
Review daily or weekly attendance.
Identify attendance trends.
Compare attendance across groups.
Support workforce or education reporting.
Best for: Attendance dashboards that monitor participation over time.
Production Checklist for Dashboard Charts
Before adding a chart to a live dashboard, review the implementation against these checks:
The visualization answers a specific question.
The data structure matches the expected chart configuration.
The chart container has a defined height or aspect ratio.
Tooltips display the relevant values.
Legends distinguish multiple series.
Colors follow the application's design system.
Theme changes maintain contrast and readability.
Loading, empty, and error states are handled.
Long labels and large values display correctly.
Date and currency formats remain consistent.
Accessibility and keyboard navigation are tested.
Client-side rendering requirements are addressed.
The chart has been tested with real application data.
Pay attention to empty responses, missing values, and changes in the reporting period. These cases may reveal problems that are not visible in a static preview.
Integrating Charts Into a Complete Dashboard
A chart is one element of a dashboard. Depending on the user's task, the page may also need filters, summary cards, tables, navigation, and supporting metrics.
Start by identifying the main question the dashboard should answer. A SaaS analytics page may focus on recurring revenue and customer activity. An ecommerce dashboard may compare product sales and acquisition channels. A financial interface may help users review revenue, expenses, and settlements.
Explore the dashboard UI blocks collection for supporting layouts. The shadcn dashboard templates can help with broader page structures, while the components collection provides reusable interface elements.
Frequently Asked Questions
How can I install shadcn chart blocks in a Next.js dashboard?
Use the chart's CLI command to add its implementation to your project, then connect the generated component to your data source. Check its dependencies, client-side rendering requirements, container dimensions, and chart configuration before using it in production.
Which chart should I choose for revenue, sales, and website analytics?
Line charts work well for trends over time, bar charts for comparing values, area charts for showing volume changes, and donut charts for displaying distributions. Select the visualization based on the relationship you need to communicate and the number of categories users must compare.
What should I check before using shadcn charts with Base UI or Radix UI?
Review the component's documented dependencies and the UI primitive implementation used in your project. Base UI and Radix UI are separate libraries, so check compatibility, installation requirements, and implementation-specific configuration before adding the chart.
Conclusion
Shadcn charts give React and Next.js developers a practical starting point for data-driven interfaces. The examples in this guide cover sales, revenue, expenses, marketing channels, product performance, settlements, department statistics, attendance, and financial forecasting.
To integrate a chart effectively, choose it according to the relationship represented by the data, connect it to a reliable source, and test it within the complete dashboard. Review formatting, accessibility, empty states, and the distinction between actual results and projections.
Start with the visualization that answers your users' most important question, then build the supporting interface around it. Explore the chart blocks and components and the CLI installation guide to move from an example to a working implementation.